Wastewater Surveillance
a project of wastewater surveillance for pathogens (i.e., SARS-CoV-2, S. Typhi)
Part 1
Designing a Typhoid Environmental Surveillance Study: A Simulation Model for Optimum Sampling Site Allocation


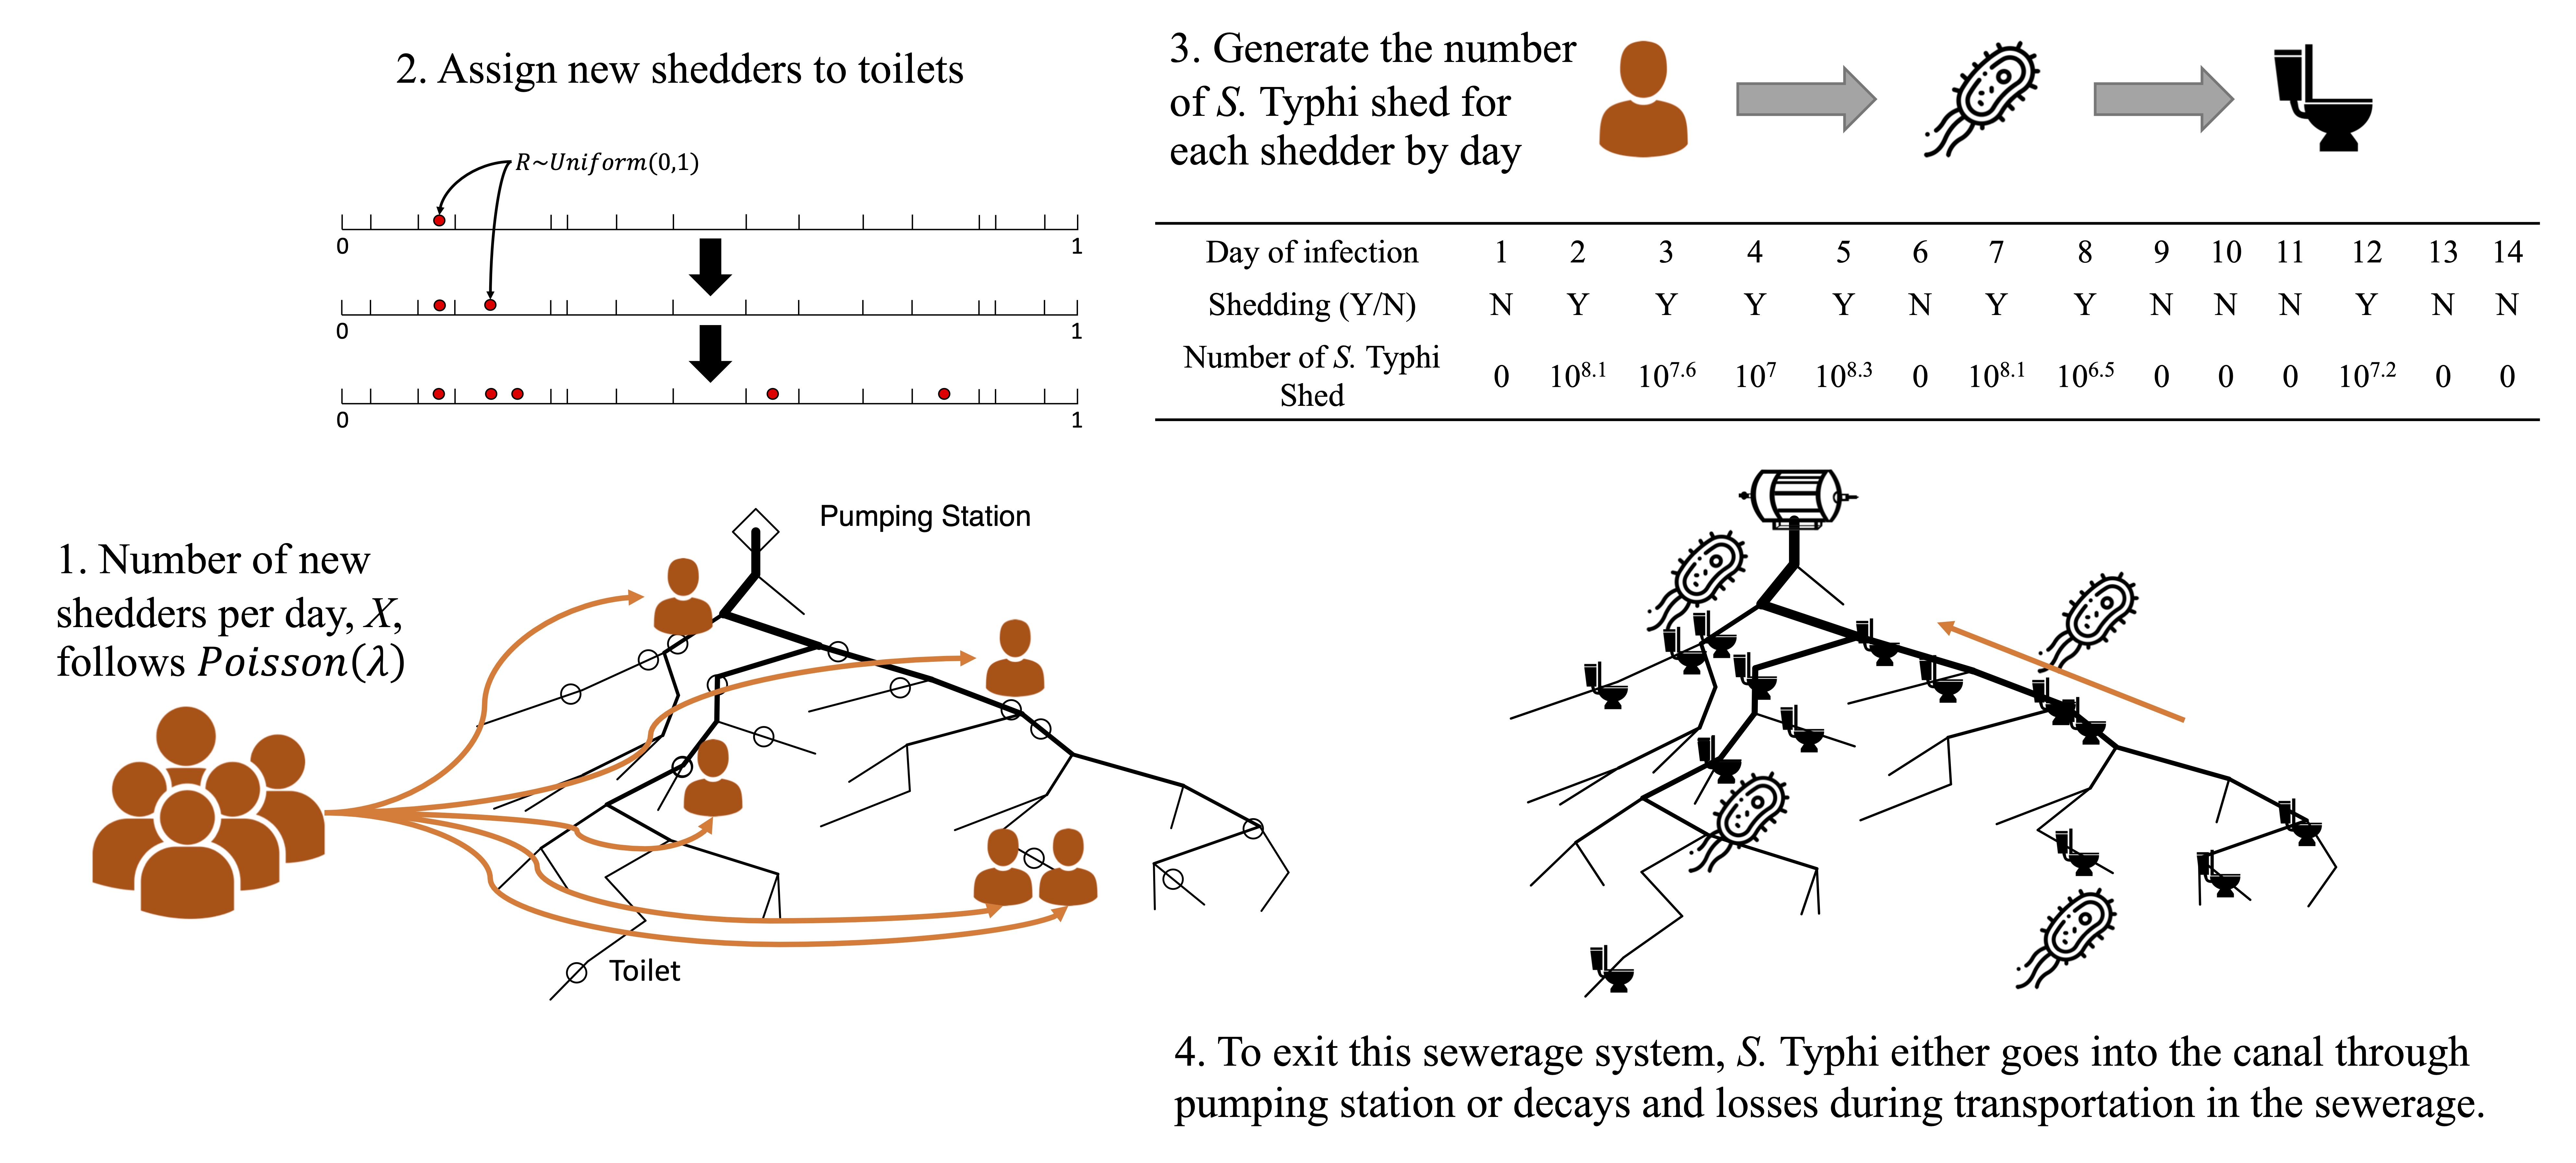
Environmental surveillance can be used for monitoring enteric disease in a population by detecting pathogens, shed by infected people, in sewage. Detection of pathogens depends on many factors: infection rates and shedding in the population, pathogen fate in the sewerage network, and also sampling sites, sample size, and assay sensitivity. This complexity makes the design of sampling strategies challenging, which creates a need for mathematical modeling to guide decision making.
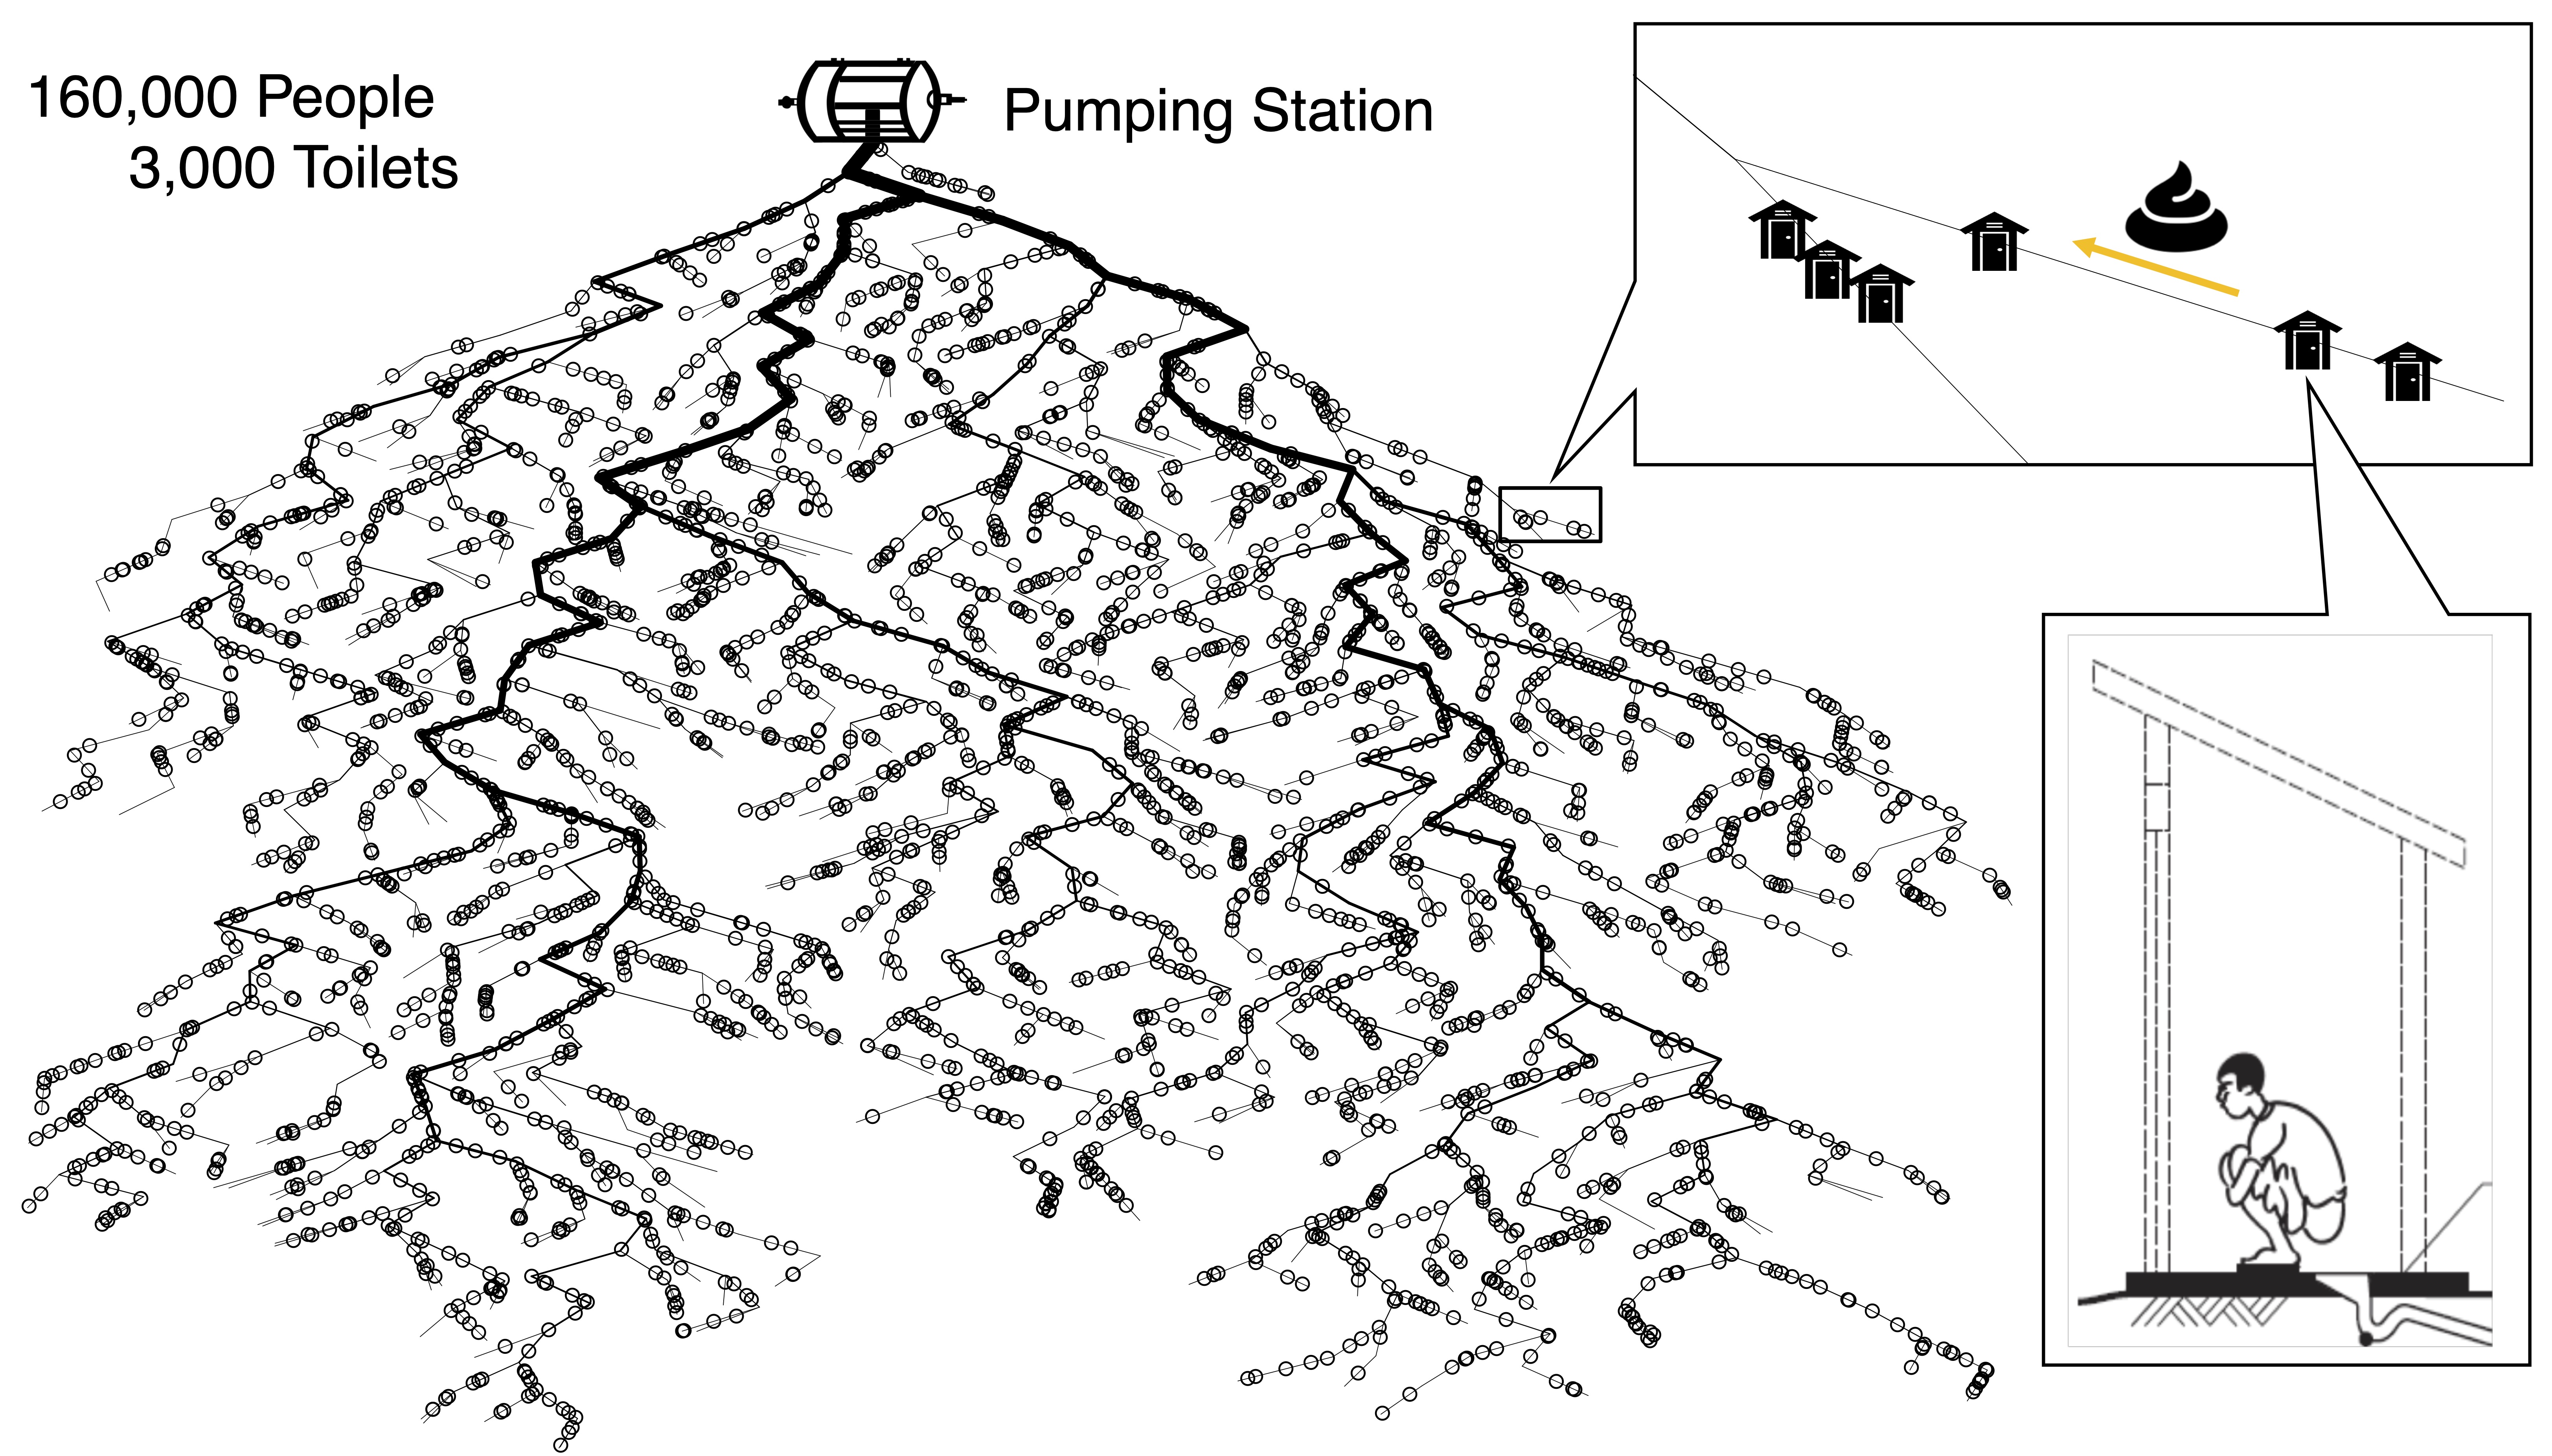
In the present study, a model was developed to simulate pathogen shedding, pathogen transport and fate in the sewerage network, sewage sampling, and detection of the pathogen. The simulation study used Salmonella enterica serovar Typhi (S. Typhi) as the target pathogen and two wards in Kolkata, India as the study area. Five different sampling strategies were evaluated for their sensitivity of detecting S. Typhi, by sampling unit: sewage pumping station, shared toilet, adjacent multiple shared toilets (primary sampling unit), pumping station + shared toilets, pumping station + primary sampling units. Sampling strategies were studied in eight scenarios with different geographic clustering of risk, pathogen loss (decay, leakage), and sensitivity of detection assays. A novel adaptive sampling site allocation method was designed, that updates the locations of sampling sites based on their performance. We then demonstrated how the simulation model can be used to predict the performance of environmental surveillance and how it is improved by optimizing the allocation of sampling sites.

The results are summarized as a decision tree to guide the sampling strategy based on disease incidence, geographic distribution of risk, pathogen loss, and the sensitivity of the detection assay. The adaptive sampling site allocation method consistently outperformed alternatives with fixed site locations in most scenarios. In some cases, the optimum allocation method increased the median sensitivity from 45% to 90% within 20 updates.
Part 2
Designing a Multilevel COVID-19 Wastewater Surveillance Study in Atlanta
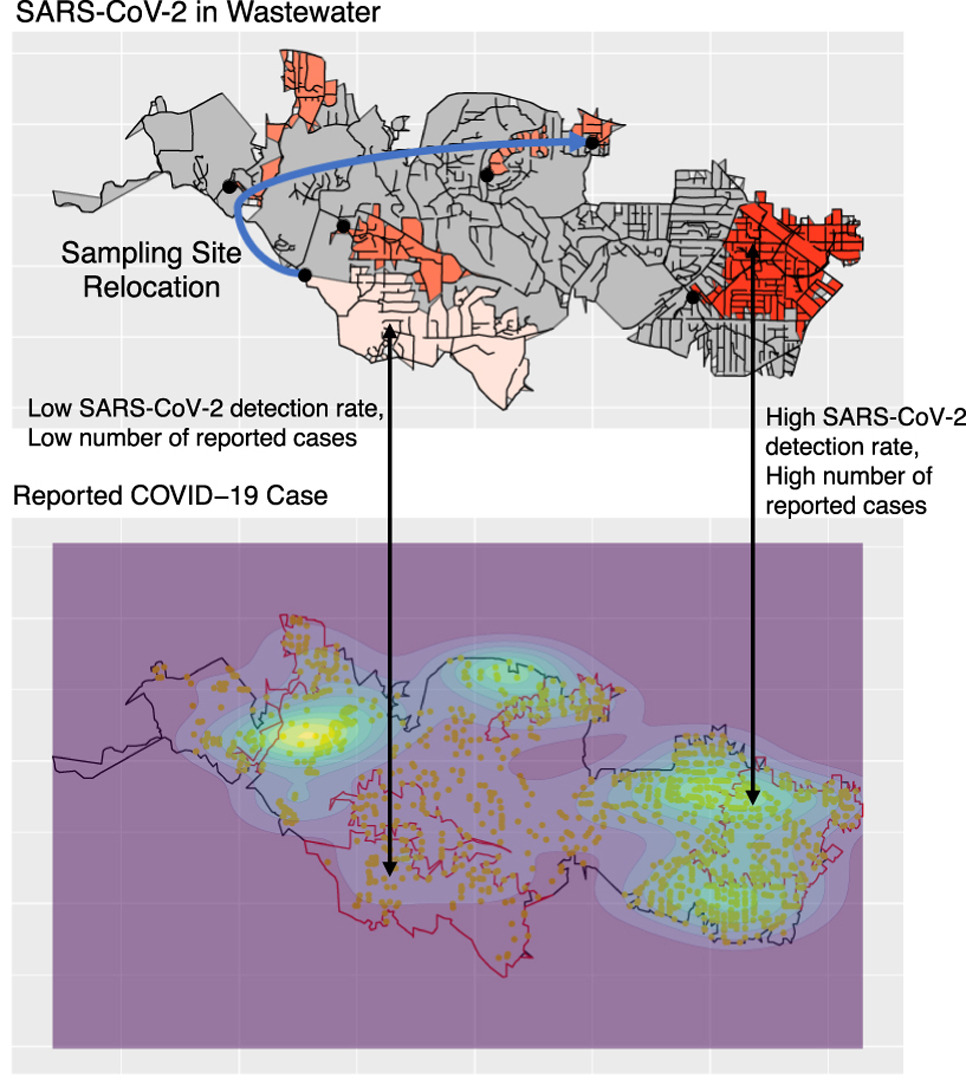
Monitoring SARS-CoV-2 in wastewater is a valuable approach to track COVID-19 transmission. Designing wastewater surveillance (WWS) with representative sampling sites and quantifiable results requires knowledge of the sewerage system and virus fate and transport. We developed a multi-level WWS system to track COVID-19 in Atlanta using an adaptive nested sampling strategy. From March 2021 to April 2022, 868 wastewater samples were collected from influent lines to wastewater treatment facilities and upstream community manholes. Variations in SARS-CoV-2 concentrations in influent line samples preceded similar variations in numbers of reported COVID-19 cases in the corresponding catchment areas. Community sites under nested sampling represented mutually-exclusive catchment areas. Community sites with high SARS-CoV-2 detection rates in wastewater covered high COVID-19 incidence areas, and adaptive sampling enabled identification and tracing of COVID-19 hotspots. This study demonstrates how a well-designed WWS provides actionable information including early warning of surges in cases and identification of disease hotspots.
